AI-Powered Trading Dashboard
✨ See DTJ in Action - Real Dashboard Screenshots
These are actual screenshots from the DTJ dashboard showing real trading data and analytics
💡 Smart Insights
- Real-time profit factor analysis
- Win rate tracking across time periods
- Drawdown monitoring & alerts
- Position sizing optimization
🎯 Interactive Features
- Dynamic filtering by timeframe
- Multi-account performance comparison
- Customizable chart layouts
- Export capabilities for reports
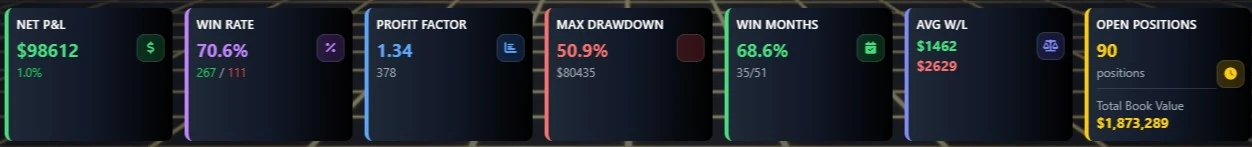
Key Performance Indicators Dashboard
Dashboard KPIs Preview
Loading optimized image...
🔍 Click to see full dashboard
Real-time KPIs: Net P&L, Win Rate, Profit Factor, Max Drawdown, and more
Monthly Performance Breakdown

Monthly Returns Table
Loading optimized image...
📊 Interactive monthly analysis
Track your performance month-by-month with detailed breakdowns and yearly summaries
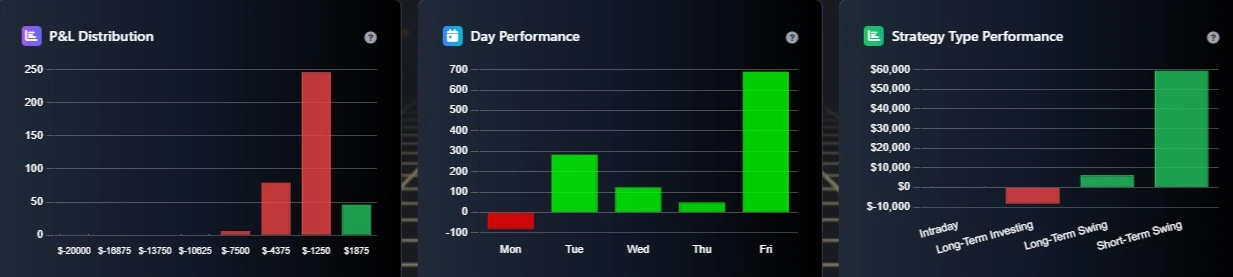
Advanced Analytics Charts
Analytics Charts
Loading optimized image...
📈 Multi-chart analytics view
Comprehensive charts: Win/Loss distribution, Daily performance, P&L analysis, and more
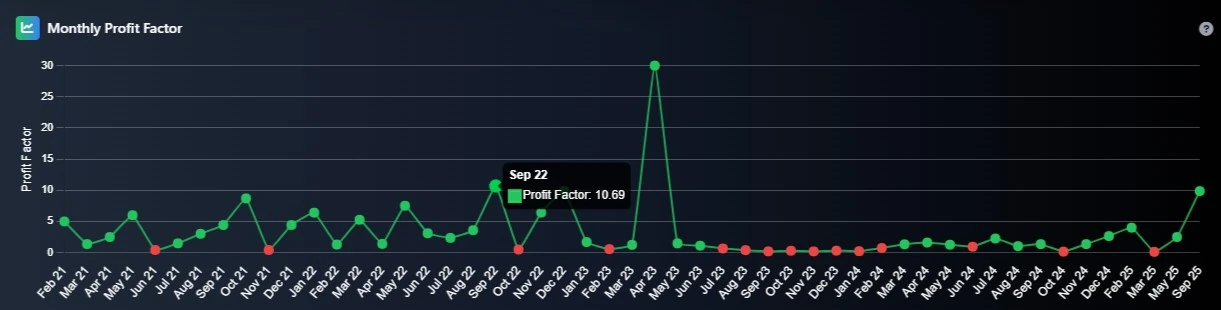
Profit Factor Evolution
Profit Factor Chart
Loading optimized image...
🎯 Track trading efficiency
Monitor your profit factor trends to identify when your trading strategy is performing best
Cumulative Performance Trend

Performance Trend
Loading optimized image...
📈 See your growth journey
Visualize your trading journey with cumulative P&L trends and growth patterns
Advanced Analytics Engine
✨ See DTJ Analytics in Action - Real Analysis Screenshots
These are actual screenshots from the DTJ analytics engine showing comprehensive trading analysis and insights
🧠 AI-Powered Insights
- Comprehensive performance analysis
- Monthly breakdown insights
- Strategy performance evaluation
- Risk/reward optimization tips
📊 Deep Analytics
- Win rate tracking across periods
- Best/worst trade identification
- Calendar month performance
- Trading type comparisons
Comprehensive Trading Analysis

🔍 Explore detailed metrics
Complete overview with win rates, profit factor, detailed metrics, calendar analysis, and strategy performance
Monthly Performance Breakdown
Comprehensive monthly returns table from 2020-2025 showing detailed P&L, percentages, and trade counts by month and year
AI-Generated Key Insights

💡 Get actionable insights
AI-powered insights highlighting your best trading patterns, challenging periods, and optimization opportunities
Seamless Data Import
✨ See DTJ Smart Import in Action - Real Import Interface
This is the actual DTJ import interface showing CSV/Excel file processing with intelligent data mapping
🤖 AI-Powered Processing
- Automatic column mapping
- Smart data validation
- Error detection & reporting
- Auto-categorization
📁 File Support
- CSV, Excel (.xlsx, .xls) formats
- Multiple date formats support
- Header row detection
- Preview & confirm before import
Smart CSV Import Interface

📁 Experience smart importing
Intelligent CSV import with automatic field detection, supported formats, and comprehensive error reporting
Professional Tax Reporting
✨ See DTJ Tax Reports in Action - Real Export Interface
This is the actual DTJ tax export interface showing compliant T5008 (Canada) and 1099-B (USA) form generation
US & Canada Only
🏛️ Tax Compliance
- T5008 forms for Canada (CRA)
- 1099-B forms for USA (IRS)
- All required fields included
- Professional formatting
📊 Export Options
- CSV spreadsheet format
- Summary report (text)
- Year and account filtering
- Only closed trades included
Tax Report Export Interface

📄 Generate compliant tax reports
Professional tax export interface with T5008 (Canada) and 1099-B (USA) support, complete field mapping, and important compliance notes
Comprehensive Trading Education
✨ Structured Learning Modules for All Levels
Access 50+ comprehensive trading education modules covering fundamentals to advanced strategies
📚 Learning Modules
- Day Trading 101 & Psychology
- Risk Management & Position Sizing
- Forex, Crypto & Stocks Trading
- Technical Analysis Masterclass
🎯 Features
- Video lessons & PDFs
- Interactive quizzes & tests
- Ebooks library
- Recommended readings
- Sources & tools
AI-Powered Trade Summary Reports
✨ Intelligent Analysis Written by AI
Let AI analyze your trading behavior, identify patterns, and generate actionable insights
🤖 AI Analysis
- Automatic performance summaries
- Behavioral pattern recognition
- Personalized improvement suggestions
- Risk assessment & recommendations
📊 Report Sections
- Performance analysis & trends
- Trade pattern insights
- Strength & weakness assessment
- Actionable next steps
AI-Powered Trade Tagging & Classification
✨ Intelligent Trade Organization & Analysis
AI automatically categorizes trades and identifies behavioral patterns to boost your trading performance
🏷️ Smart Categorization
- Plan tags (setup identification)
- Action tags (execution method)
- Result tags (trade outcome)
- Custom tag creation
📈 Analysis Benefits
- Identify winning trade patterns
- Spot trading mistakes & biases
- Filter & compare tag performance
- Refine your trading strategy
Professional Ticker Research & Valuation
✨ Comprehensive Stock & ETF Analysis
Research stocks with valuation metrics, analyst ratings, and AI-powered buy/sell recommendations
💰 Valuation Metrics
- P/E ratios (TTM & Forward)
- Price-to-Sales & Market Cap
- Dividend yield & 52-week range
- Earnings dates & analyst targets
🎯 AI Recommendations
- Buy/Sell/Hold recommendations
- 5-factor valuation scoring
- Analyst consensus & targets
- Bullish & bearish signal analysis
Real-Time Market Intelligence
✨ See DTJ Live Market Data in Action - Real Market Intelligence
These are actual live market data feeds integrated into DTJ showing real-time prices and economic calendar
📈 Live Market Data
- Real-time stock price feeds
- Live ticker tape display
📅 Economic Calendar
- Live economic events feed
- Impact level indicators
- Forecast vs actual data
- Weekly & monthly filters
Live Stock Market Ticker

📊 Track live market moves
Live stock ticker showing real-time prices for major market indices and individual stocks with percentage changes
Live Economic Calendar

📅 Stay ahead of market events
Live economic calendar powered by Investing.com with upcoming events, impact levels, forecasts vs actual data, and market timing
Account Health Monitoring
✨ See DTJ Account Health in Action - Real-Time Portfolio Monitoring
This is actual account health dashboard showing real trading performance across multiple accounts
🏥 Health Monitoring
- Real-time account performance
- Multi-account overview
- P&L tracking across brokers
- Performance percentage alerts
🛡️ Risk Management
- Automated drawdown alerts
- Position sizing warnings
- Risk exposure monitoring
- Account health scoring
Real-Time Account Health Dashboard
Account health overview showing real performance across Demo/Paper Trade, IBKR, TD Ameritrade, and Wealthsimple accounts with P&L percentages and trade counts
Unlimited Account Creation
✨ See DTJ Account Management in Action - Multi-Broker Organization
This is actual account organization interface showing real broker accounts with trade counts and creation dates
🏦 Offline Multi-Broker Support
- Unlimited Offline accounts creation - No broker connection required
- individual perfromance tracking
- Demo/Paper Trade Vs Live account segregation
- Custom account naming & organization
📊 Unified Analytics
- Cross-account performance comparison
- Portfolio diversification insights
- Consolidated P&L reporting
- Account-specific KPI tracking
Account Management Dashboard

🏦 Manage multiple accounts
Account organization dashboard showing Demo/Paper Trade, IBKR, TD Ameritrade, and Wealthsimple accounts with trade counts and creation dates, plus "Add Account" functionality
AI-Powered Trade Insights & Risk Analysis
✨ See DTJ AI Trading Intelligence in Action - Smart Trade Analysis
These are actual AI-powered features integrated into DTJ showing real trading insights, risk analysis, and smart recommendations
🤖 Smart Recommendations
- Real-time position sizing suggestions
- Historical performance pattern analysis
- Symbol-specific success rate insights
- Optimal entry/exit timing suggestions
⚡ Risk Analysis
- Portfolio exposure warnings
- Risk-reward ratio calculations
- Drawdown impact predictions
- Trading pattern optimization
AI-Enhanced Trade Entry Form
AI-enhanced trade entry showing NVDA position with real-time insights: 81 trades history, 85.2% win rate, strong performance metrics, and intelligent position sizing recommendations
AI Performance Insights Dashboard

📊 View performance patterns
AI performance analysis with trading alerts, seasonal patterns (May-October weakness), portfolio drawdown warnings, and smart reminders for profitable trading strategies
AI Risk Analysis Engine
AI risk analysis showing $1410 trade value (0.1% portfolio), Low risk level, with intelligent position sizing guide: Conservative (336 shares), Moderate (538 shares), Aggressive (807 shares)
AI Smart Recommendations System
AI smart recommendations including best trading days (Friday +$9790), avoid patterns (Monday -$514), trading reminders, risk management tips, and seasonal insights for optimal trading


